Graphics by Marybeth Rivera

STANDARDS

CCSS: 3.MD.B.4, 4.MD.A.2

Thanksgiving Stats

The first Thanksgiving dates back to November 1621. The Pilgrims and the Wampanoag Indians enjoyed a feast together at the Plymouth colony in Massachusetts to celebrate a successful harvest. They ate seafood and goose—not turkey as we do today—and they competed in races instead of playing football.

William Bradford, the governor of the Plymouth colony, organized America’s first Thanksgiving. But it wasn’t until November 1863 that President Abraham Lincoln made Thanksgiving a national holiday.

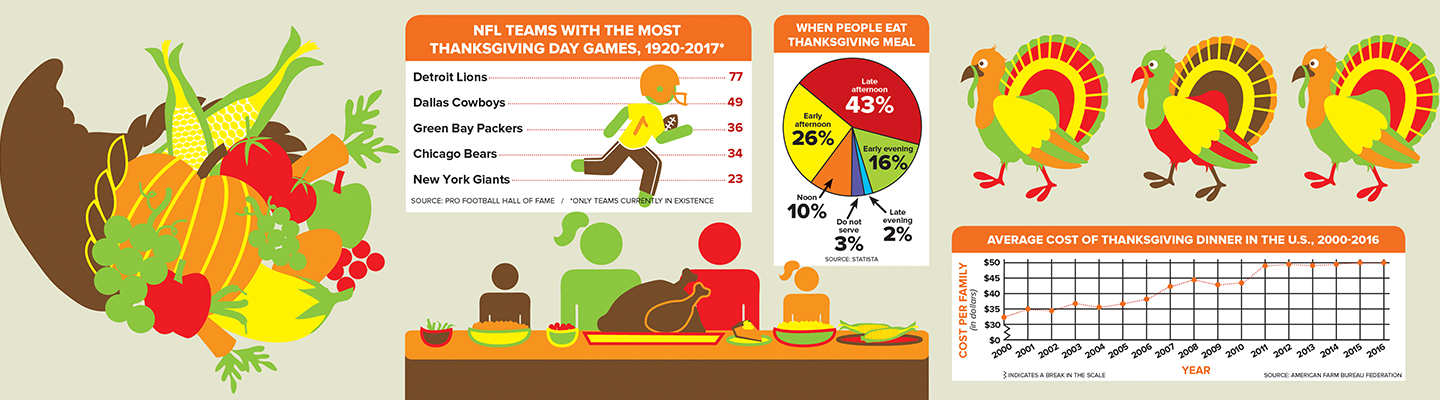
Football became part of the tradition when Yale University played Princeton University on Thanksgiving Day in 1876. In 1920, Gimbel’s department store in Philadelphia held the first Thanksgiving parade, followed in 1924 by Macy’s in New York City. Macy’s will hold its 91st parade this year.

The first Thanksgiving dates was in November 1621. The Pilgrims and the Wampanoag Indians enjoyed a feast together. This happened at the Plymouth Colony in Massachusetts.

They celebrated a successful harvest. But they didn't eat turkey. They ate seafood and goose. And they didn't play football. They competed in races instead.

William Bradford organized America's first Thanksgiving. He was the governor of the Plymouth Colony. Many years later, Thanksgiving became a national holiday. President Abraham Lincoln decided this in November 1863.

The first football game on Thanksgiving Day was in 1876. Yale University played Princeton University. In 1920, Gimbels department store in Philadelphia held the first Thanksgiving parade. Macy's in New York City followed in 1924. Macy's will hold its 91st parade this year.

How many more games have the Detroit Lions played on Thanksgiving than the Chicago Bears and New York Giants combined?

A. 8

B. 20   

C. 43   

D. 54

How many more games have the Detroit Lions played on Thanksgiving than the Chicago Bears and New York Giants combined?

A. 8

B. 20   

C. 43   

D. 54

About 1/4 of Americans prefer to have their Thanksgiving meal during which time period?

A. noon  

B. early afternoon

C. late afternoon

D. early evening

About 1/4 of Americans prefer to have their Thanksgiving meal during which time period?

A. noon  

B. early afternoon

C. late afternoon

D. early evening

What information is in the y-axis of the graph “Length of Select Balloons in Macy’s Parade, 2016”?

A. balloon names  

B. length in inches           

C. length in feet

D. balloon cost in dollars

What information is in the y-axis of the graph “Length of Select Balloons in Macy’s Parade, 2016”?

A. balloon names  

B. length in inches           

C. length in feet

D. balloon cost in dollars

Which balloon in the 2016 Macy’s parade measured 62 feet long?

A. Thomas the Tank Engine  

B. Elf on the Shelf           

C. Charlie Brown

D. Diary of a Wimpy Kid

Which balloon in the 2016 Macy’s parade measured 62 feet long?

A. Thomas the Tank Engine  

B. Elf on the Shelf           

C. Charlie Brown

D. Diary of a Wimpy Kid

What trend do you notice about the cost of Thanksgiving dinner from 2011 to 2016 on the line graph?

A. It has risen.  

B. It has stayed about the same.           

C. It has decreased.

D. It is unpredictable. 

What trend do you notice about the cost of Thanksgiving dinner from 2011 to 2016 on the line graph?

A. It has risen.  

B. It has stayed about the same.           

C. It has decreased.

D. It is unpredictable. 

What is the least popular time to eat a Thanksgiving meal?

A. early afternoon  

B. late afternoon           

C. early evening

D. late evening

What is the least popular time to eat a Thanksgiving meal?

A. early afternoon  

B. late afternoon           

C. early evening

D. late evening

The Pikachu balloon is half the length of the Red Mighty Morphin Power Ranger balloon.

The Pikachu balloon is half the length of the Red Mighty Morphin Power Ranger balloon.

Do you have enough information to calculate the volume (length x width x height) of any of the balloons on the bar graph? Why or why not?

Do you have enough information to calculate the volume (length x width x height) of any of the balloons on the bar graph? Why or why not?

Why is a line graph a good choice for the data being displayed in the graph “Average Cost of Thanksgiving Dinner in the U.S., 2000-2016”? 

Why is a line graph a good choice for the data being displayed in the graph “Average Cost of Thanksgiving Dinner in the U.S., 2000-2016”? 

In 1990, the average cost of Thanksgiving dinner was $28.85. During which year on the graph was the average cost of a family’s Thanksgiving dinner roughly $10 more than the average cost in 1990?

In 1990, the average cost of Thanksgiving dinner was $28.85. During which year on the graph was the average cost of a family’s Thanksgiving dinner roughly $10 more than the average cost in 1990?

videos (1)
Skills Sheets (1)
Lesson Plan (1)
Text-to-Speech